The feed-in tariff is the rate offered by electricity retailers for the electricity that consumers export back to the grid. Many solar consumers say these rates are unfair, because of the big difference between the rate they buy electricity and the rate they sell. What’s the truth?
I thought I’d take a close look at a specific house in Rockingham, Western Australia with a 2.5kW solar system to try and work out whether the feed-in-tariff in WA is fair.
Now this is a question that the public utilities office (PUO) would examine in a lot more detail, looking at the total impact for all households and for the state, but I thought it could be interesting to examine just in the context of a specific household.
Today in WA, the ‘buy back’ rate is 7.135c, which is much less than the standard ‘buy’ rate of 28.3272c. And this big spread is what creates a perception from some households that they are being “ripped-off”, and is one of the issues that drives interest in peer-to-peer electricity trading.
According to the PUO, the calculation of the feed-in-tariff (REBS rate) is supposed to reflect the value to the retailer of:
- "the wholesale cost of electricity for the retailer
- line-loss reductions provided by distributed renewable energy
- peak reductions provided by distributed renewable energy
- capacity benefits provided by renewable energy
- the costs to retailers in running REBS"
To start unpicking this, let’s start by looking at the wholesale cost of electricity.
Roof-top solar export is really just another generation source on the power grid, and in fact if we look at roof-top solar in WA as one large aggregated generator, it represents around 1.2GW of capacity, and so is much, much bigger than our next largest generator.
Most wholesale electricity in the WA electricity market is contracted via bilateral agreements between generators and retailers, or in the case of our big state-owned gentailer, a transfer price from one division to another. But we do have a fairly transparent wholesale market with reasonable liquidity that provides the best representation we have of wholesale electricity prices, which is the WEM balancing market. This market provides us an interval-by-interval price for wholesale electricity in the state.
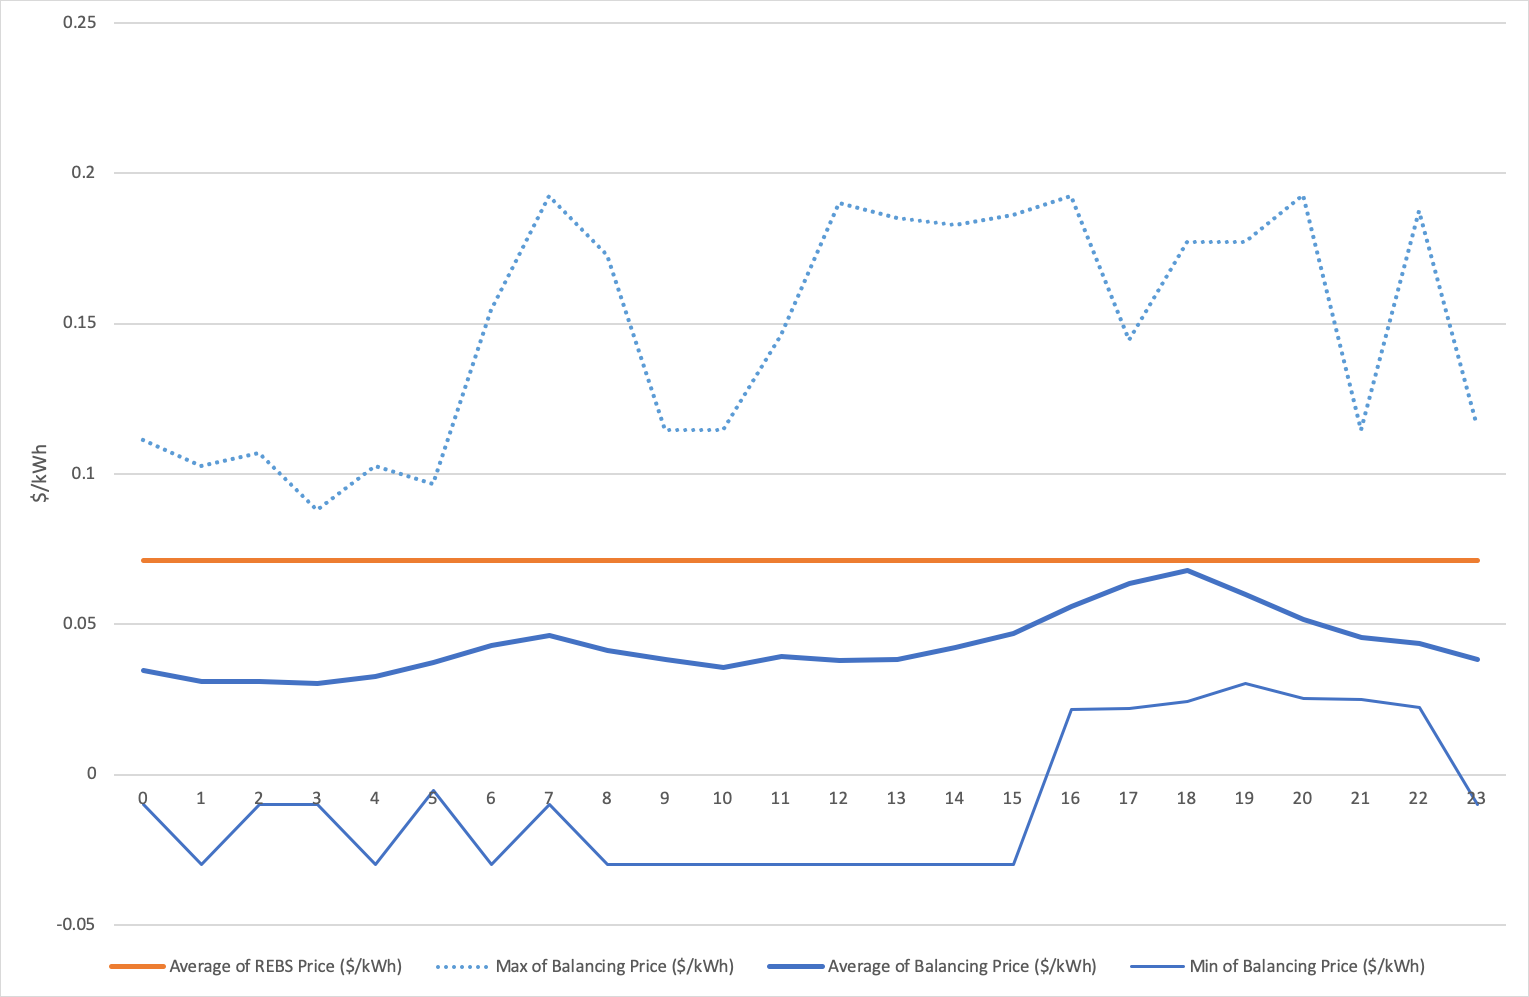
If we look at the four months from January 1st to April 30th, we can compare the average balancing price for each hour of the day in this period to the REBS rate, and we can see that the fixed REBS rate has consistently been higher than the average balancing price. You’ll also see that there are intervals where the balancing price is both much higher and times when it is much lower, and in some cases negative indicating that generators are effectively being penalised for sending out electricity.
We can then look at what our house in Rockingham has consumed or generated (and imported and exported to the grid) over the same periods, and start to examine how these rates compare.
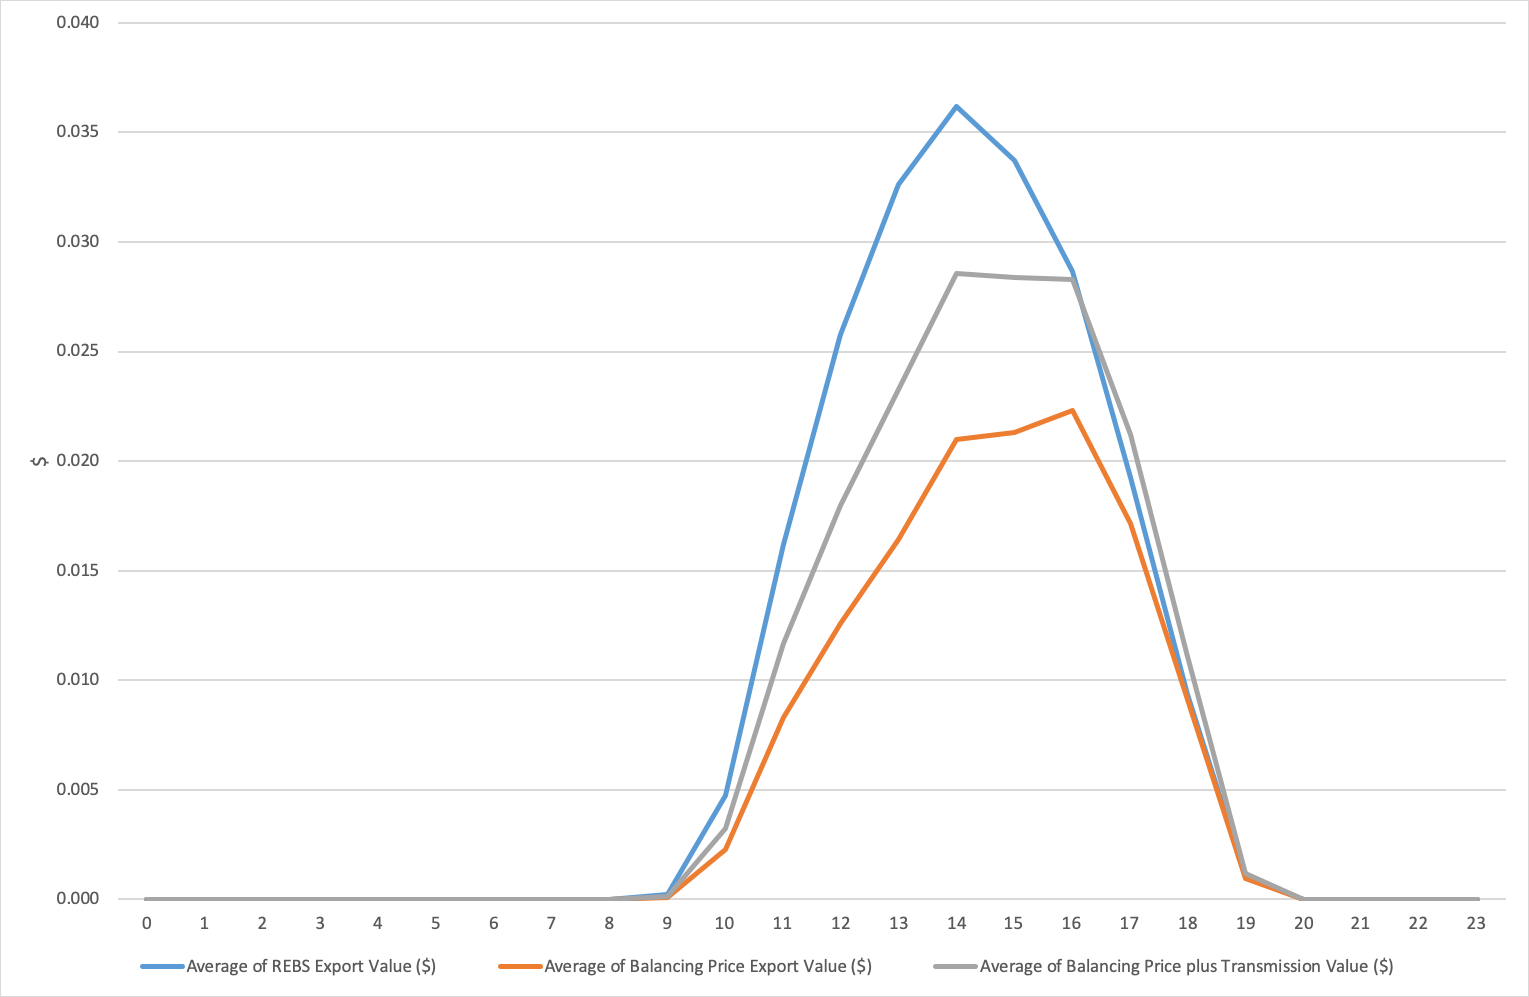
Below we should the value the household received, on average, from REBS and in a hypothetical scenario, what the household would have received if they were being paid the balancing price.
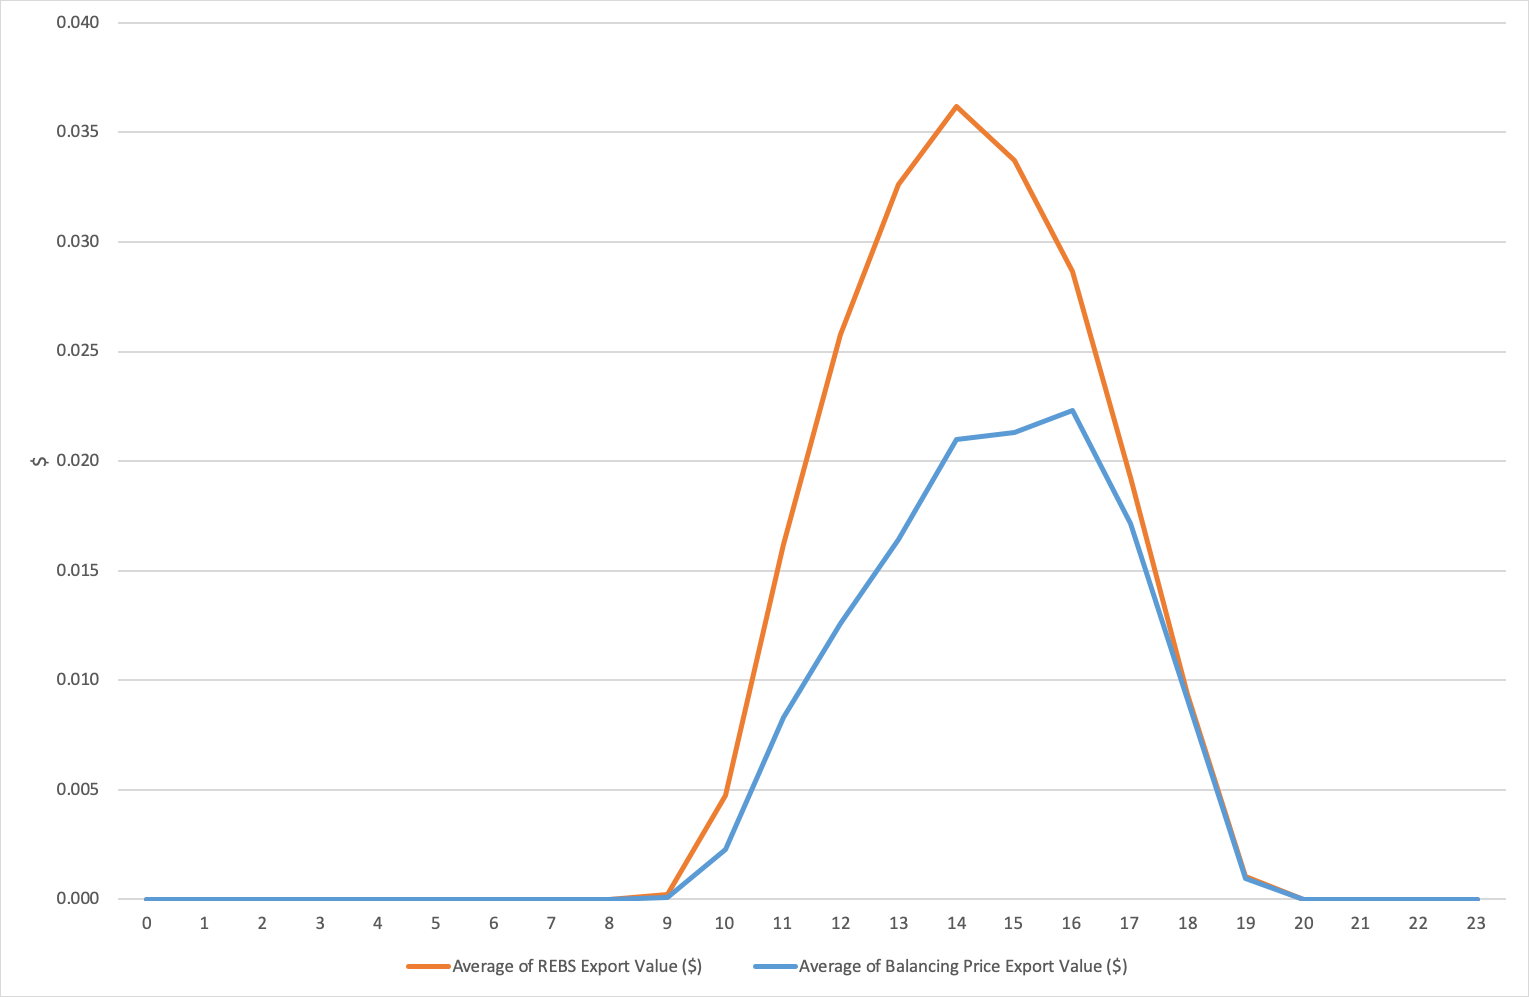
In line with our first figure, we can see that REBS is consistently delivering more value to the household than the balancing price, but also more interesting, that the value of exported solar skews higher in the late afternoon with the balancing price.
If instead of looking at the average value delivered we look at the minimum and maximum value for each hour period, we can start to see why. In relation to the times when solar systems export, balancing prices are more likely to be low or negative in the morning and middle of the day, and more likely to high in the late afternoon and early evening.
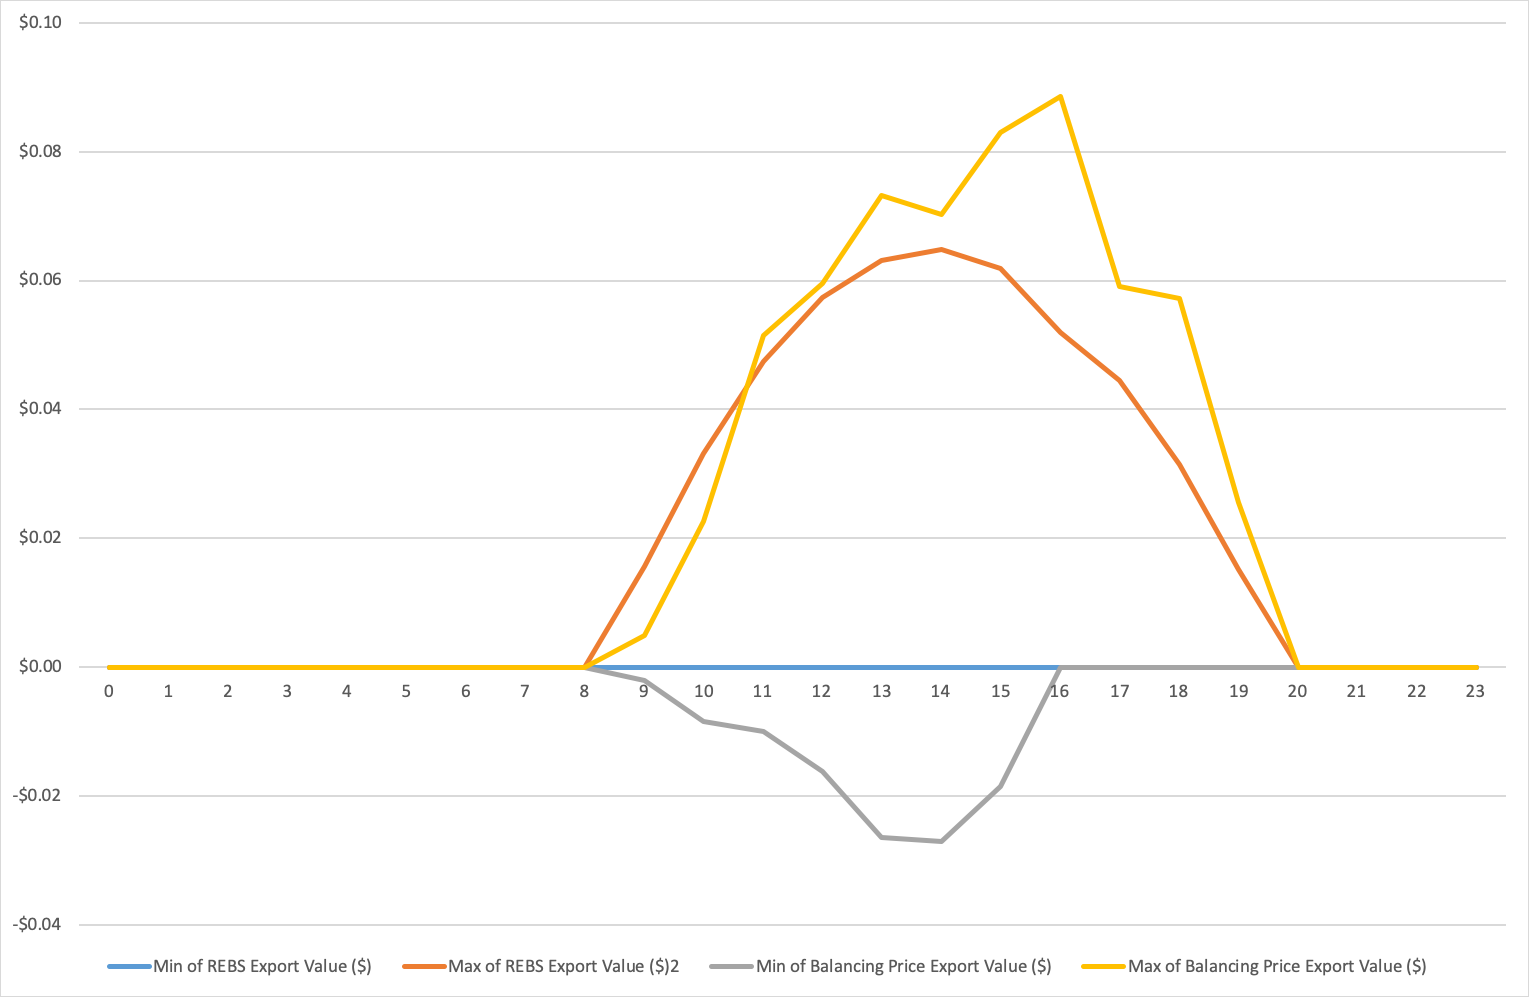
If instead of the flat REBS rate, we had a more dynamic price signal going to households, it might influence those who do have the ability to shift-loads, or use batteries to shift export times to take advantage of these dynamics.
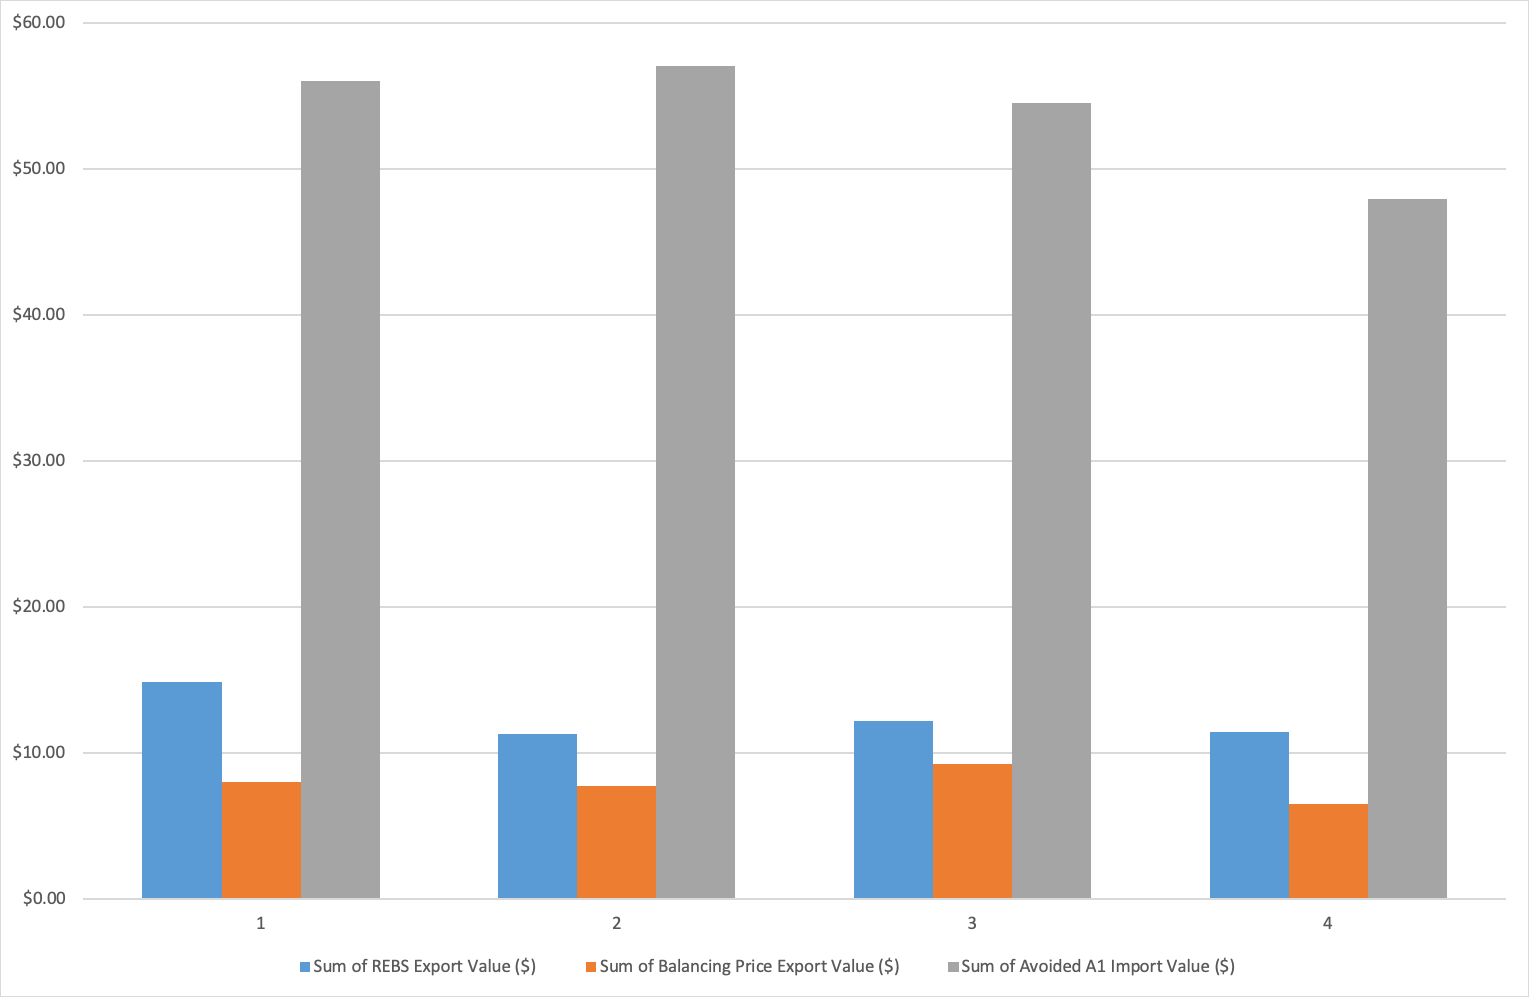
We need to be careful not to over-index on export rates. The main value of solar (and batteries) to households actually comes from minimising exports, maximising self-consumption, and, in the future with further rate-reform, minimising maximum demand. Avoiding the full cost of the import rate, which reflects more than just energy costs, is always going to be much more valuable than exporting energy.
We can see this in the figure below which shows the total value delivered over the four month period from REBS versus Balancing price, and compares that with the value delivered through avoided import.
So what are the other costs we are avoiding with self-consumption from our solar system?
The next area the calculation of the REBS rate is supposed to consider is the value associated with reduced line-losses and lower peak demand. One of the challenges here is these costs are incorporated into the Western Power network tariffs, which households don’t directly see. For this household, the tariff would be “RT13 - Anytime Energy (Residential) Bi-directional”, with the following rates:
This is an ‘anytime’ rate (i.e. no differential on peak or off-peak pricing), which most households in WA are still on, and doesn’t incorporate any network demand charges.
So with the current rate structure, the best you could argue is that any exported energy should offset another local consumers transmission costs (because they are consuming locally generated energy), or in other words a potential premium on the wholesale balancing price discussed above of 1.496c.
(To clarify: I’m taking the view that solar export isn’t in any way reducing the distribution or metering charges in the network tariff.)
But with current rate designs the electricity retailer will have to pay the transmission costs for the other consumer whether they are using locally generated energy, or energy sent up a high-voltage transmission line, say from Collie. So this is just hypothetical benefit.
For the purposes of discussion, let’s include this avoided transmission cost benefit in our calculations, and we now see the new delivered value for the household (in grey) is starting to get closer to the value of REBS.
The next area that the calculation of the REBS rate is supposed to consider is capacity benefits.
In the WEM we have a capacity market to incentivise generation capacity to ensure the peak demand generation requirements of the SWIS can be met. Capacity credits are allocated to generators, and this is funded by retailers based on the capacity requirements of their customers (called IRCR). These capacity requirements are assessed based on the twelve peak SWIS trading intervals (the 30-minute intervals with the highest demand on the grid).
For period Jan 1st to April 30th, that we have been looking at I’ve shown the recent twelve peak intervals below, along with the amount of solar power our household was exporting during those intervals. As you’ll notice these peak intervals are all late in the afternoon on hot day, with minimal export occuring.
Again, the main value of the solar system is reducing the households capacity requirements by offsetting imports from the grid, and it is this along with the world-leading deployment of household rooftop solar, that has pushed our peak periods later in the day.
But there is arguably value in the exported solar in reducing the capacity requirements of the neighbouring houses that are consuming this exported solar, rather than depending on other generation capacity on the grid. Like our discussion of transmission costs above, I don’t think with the current rules this actually reduces the retailers capacity payments, but we could argue there is value there and that the household should be rewarded accordingly.
The current reserve capacity price is $126,683 per MW. I don’t understand the market rules well enough to calculate precisely what the value of the exported solar in this case would be in offsetting capacity payments (if that were actually possible), but lets say, for the purposes of discussion, it was equivalent to 500 Watts of capacity. Then it would have a value of $63.3415 (over 12 months). This is very generous given the system only exported on average 145.75 Watts during the peak trading intervals (and wasn’t exporting for 8 of the 12 intervals).
When we do this we get a total value delivered to the household over the four months of around $63.00 (orange columns) versus $50.00 with REBS (blue columns), as shown in the first figure below.
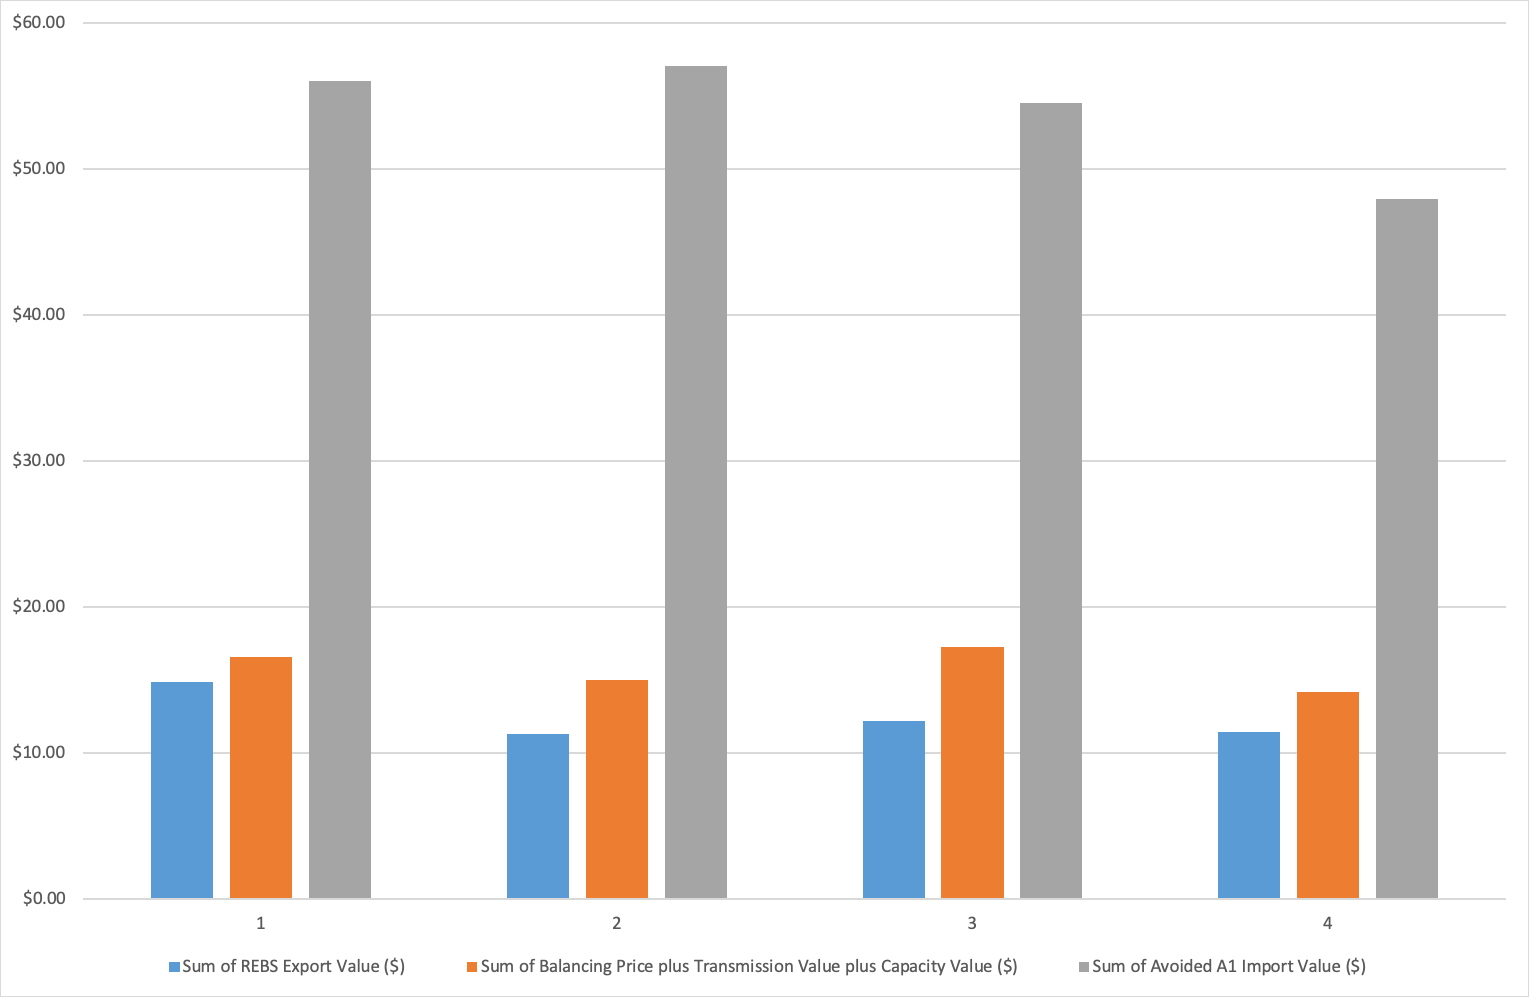
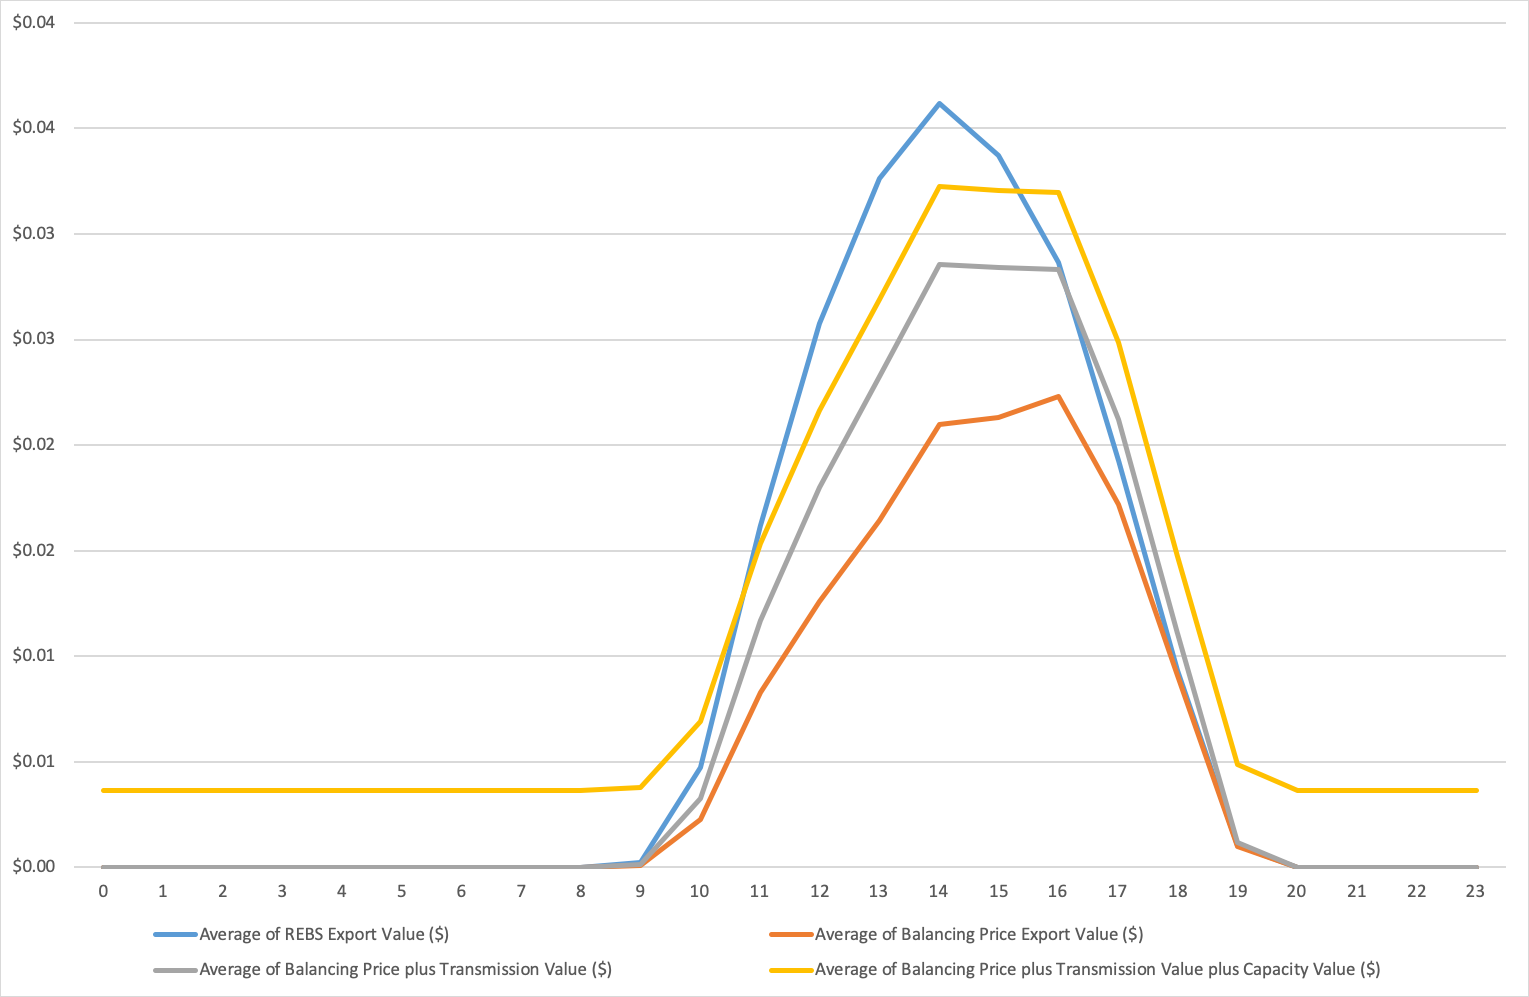
As we can see in the second figure below, what pushes us over to delivering more value than REBS (blue line) is our generous allocation for reducing capacity costs (yellow line).
So in wrapping up, unless I’ve missed something, it seems to me that the current REBS rate is probably fair, or even generous (at least for this one household and this four month period we’ve been examining).
The main value of the exported solar comes from the energy being exported (factored in using the balancing price from the wholesale market). But if we just use wholesale electricity prices, the REBS rate is delivering around $18 more value to the household over the four month period.
If we factor in some value for avoided transmission and capacity costs we can squeeze out an extra $13.00 for the household over REBS, but with current rate structures and market rules this saving can’t be realised by the electricity retailer.